Churn research
Recommending which churn problem to fix first, when most customers had several
94 conversations with churned and at-risk customers over six months. In 74% of them the customer named two or more reasons and in only 26% a single one, so I ranked the seven themes by what the company could move rather than by size. The biggest theme, price at 56%, was not the first recommendation; support friction at 29% was. It went into a quarterly business review, and Client Success worked the at-risk accounts out of it.
The situation
Candis sells invoice-management software to German SMBs. Its leadership had been watching customers leave and wanted to know why, not as a standing metric, but as one question asked properly, in time for a quarterly business review. The Head of Growth commissioned it and the Client Success and Product leads were the other readers. The material was the company's own recorded conversations with customers. I went through them and pulled 100 from July to December 2025 that touched on leaving; 94 of them survived into the analysis. This one was mine end to end.
What I decided
Include the customers who hadn't left yet. A churn analysis normally looks at accounts that have already gone, which is clean but produces a record of losses. I put at-risk customers into the same set: still paying, but showing the same pain points. That gave the report a second job: as well as explaining why customers left, it named accounts someone could still do something about. That is the part Client Success used.
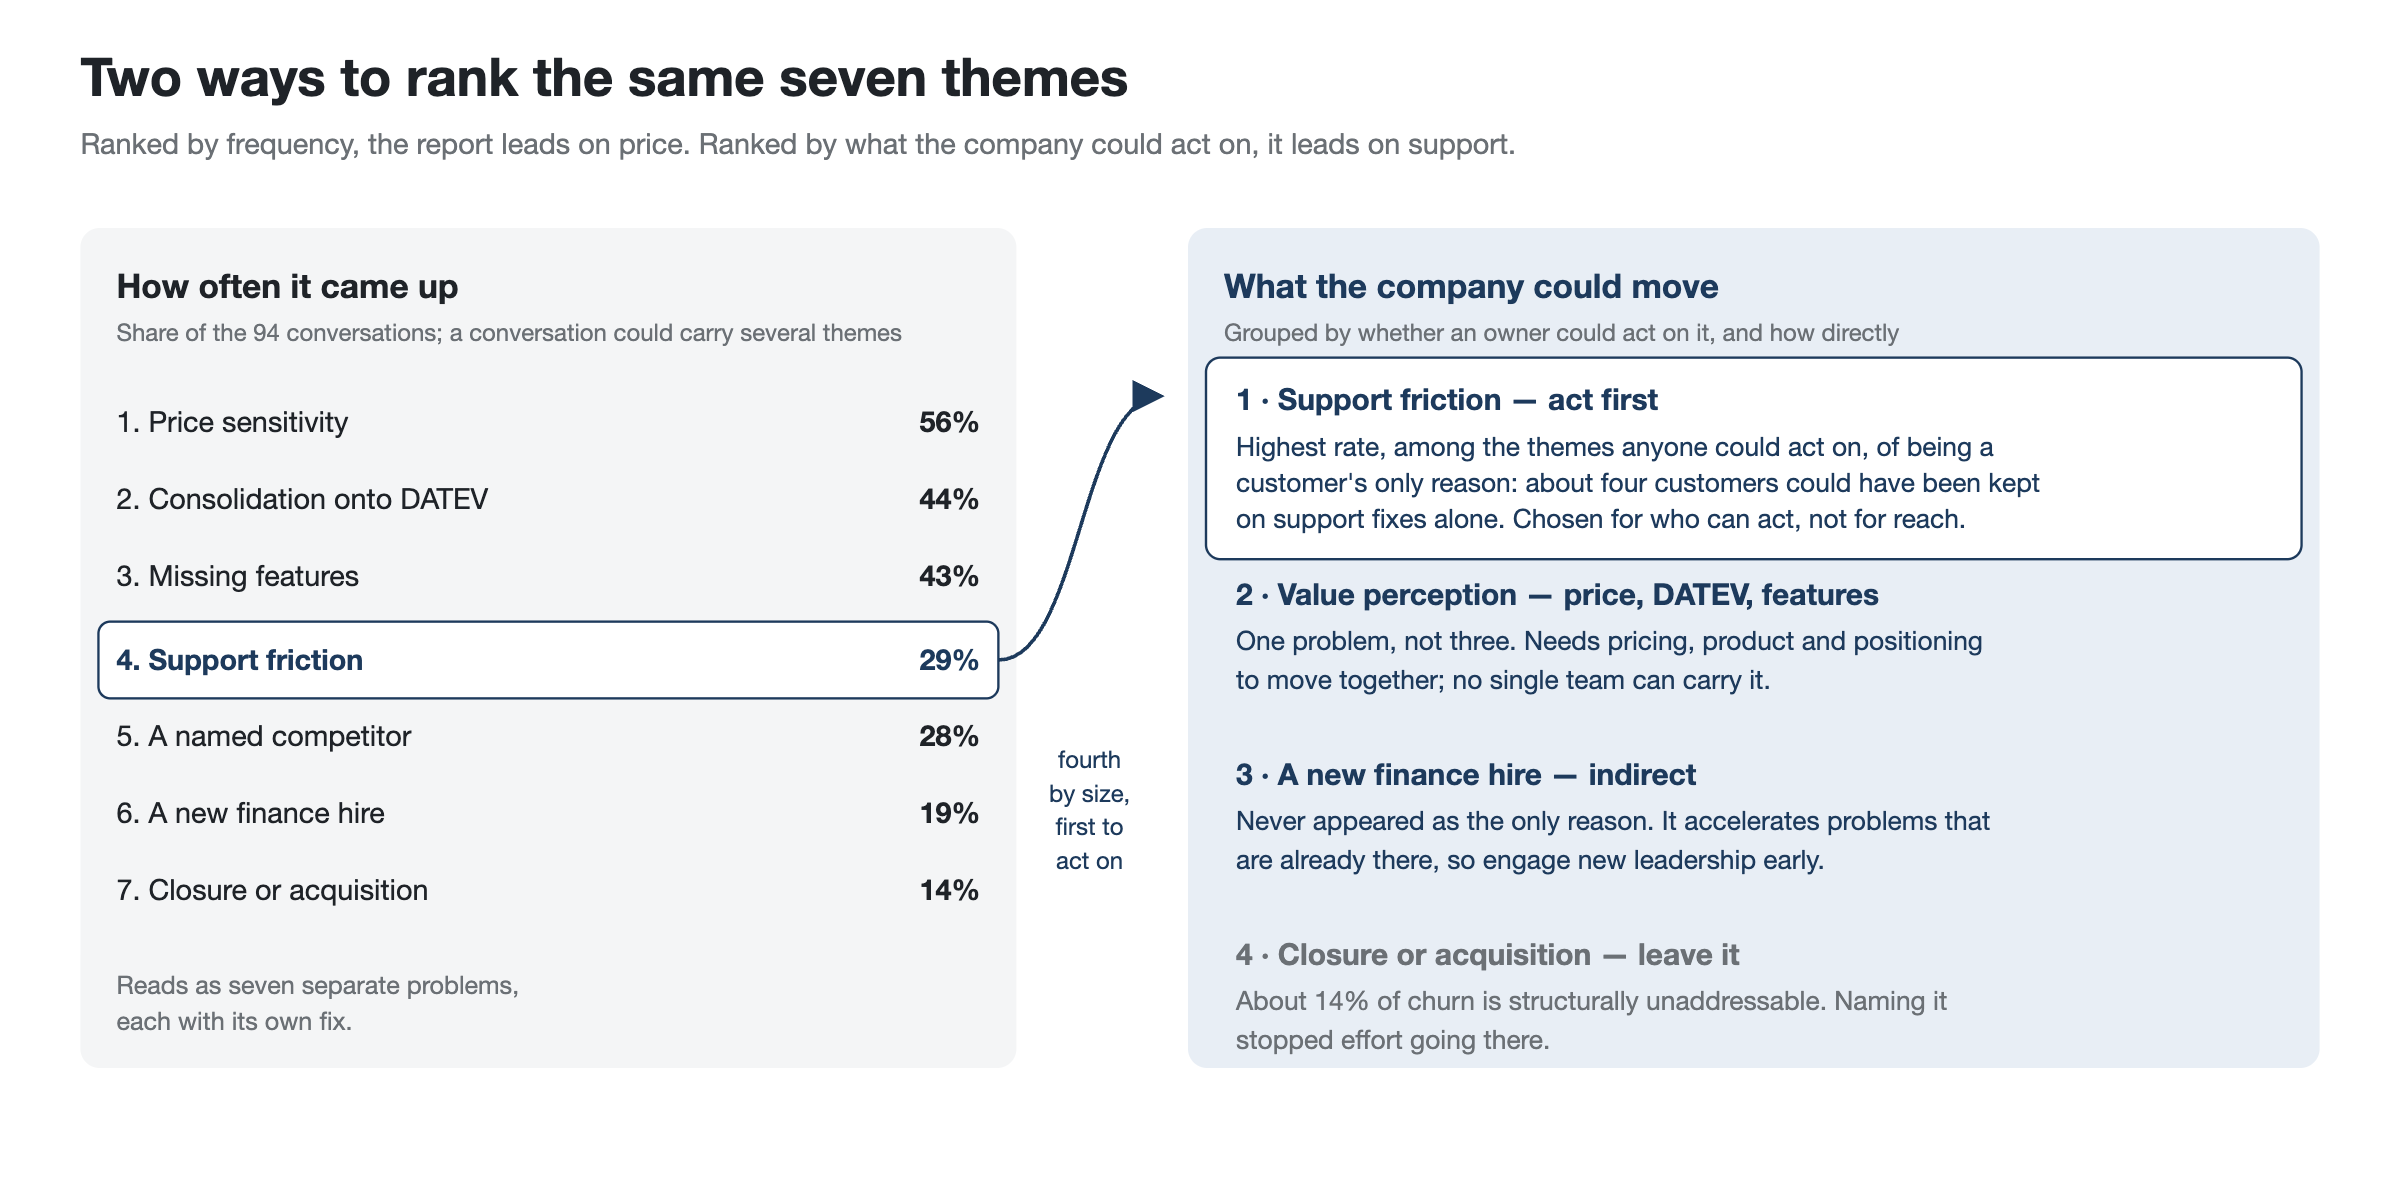
Rank the themes by what could be moved, not by how often they came up. The obvious report leads with the biggest number. Price appeared in 56% of conversations, consolidation onto DATEV in 44%, and missing features in 43%. DATEV is the accounting platform most German SMBs' tax advisers already work in. Support friction was fourth, at 29%. I led on support because among the themes anyone could act on it had the highest rate of being the only reason a customer gave: four customers named support as their only reason. That is a small number and the report says so; no single theme carries much of the churn by itself. The ranking was about who could act without waiting for anyone else, not about which fix would recover the most. Price, DATEV and features I grouped into one value-perception problem needing pricing, product and positioning to move together. Closures and acquisitions, about 14%, I called structurally unaddressable, so that nobody spent effort there.
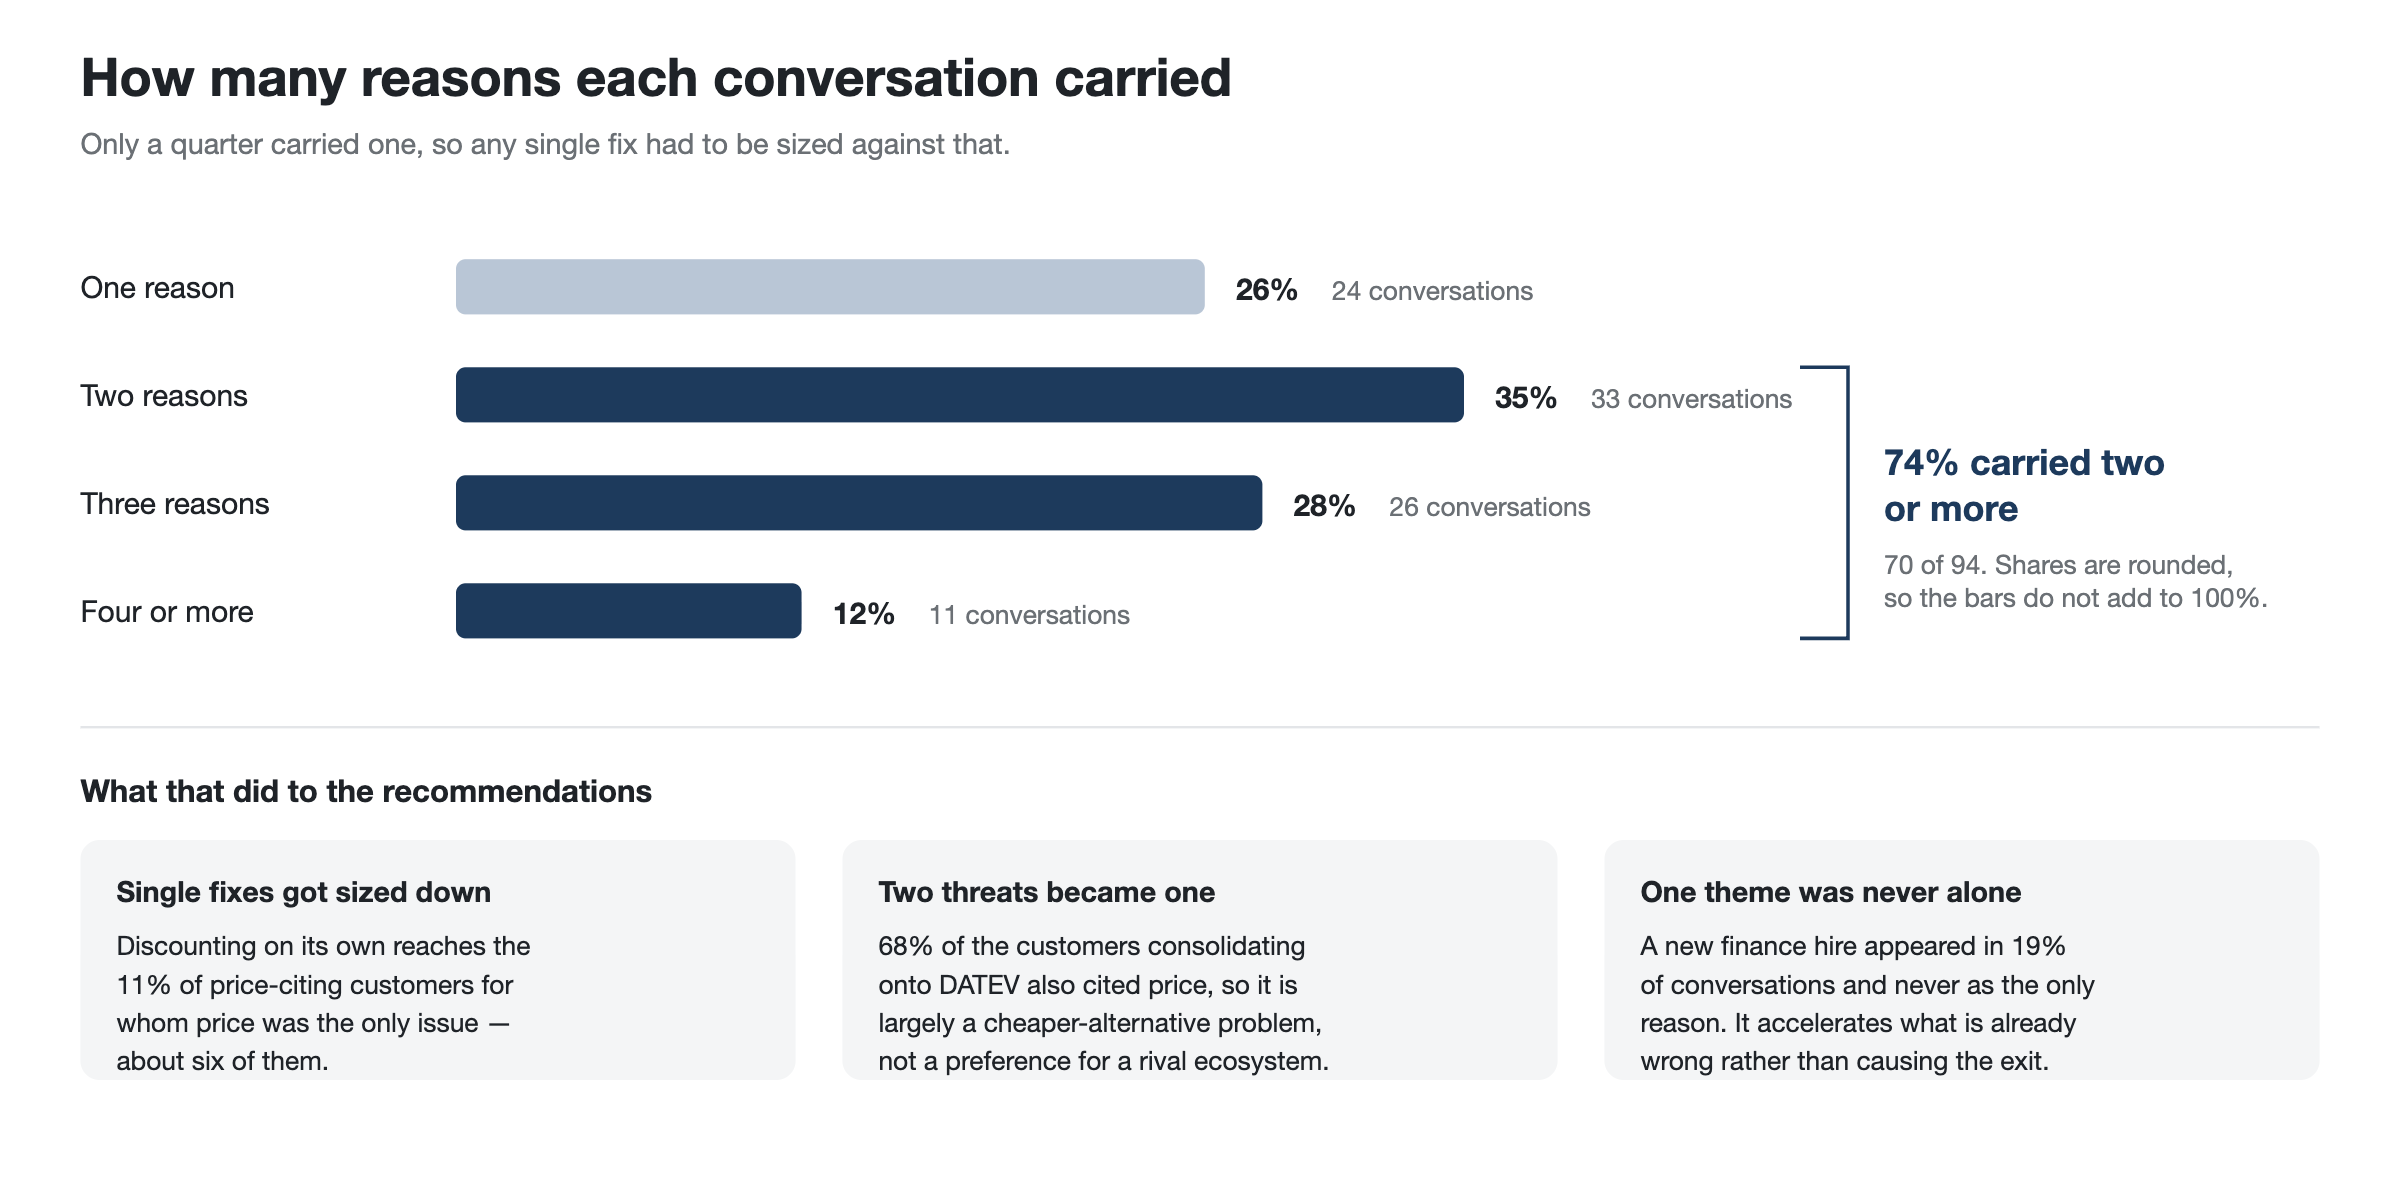
Count how the reasons arrived together, not only how often each one appeared. A ranked list of seven themes reads as seven independent problems with seven separate fixes. Counting co-occurrence showed otherwise: 74% of conversations carried two or more reasons and only 26% carried one. That resized every recommendation; discounting on its own reaches the 11% of price-citing customers for whom price was the sole issue, about six of them. It also merged two threats into one: 68% of customers consolidating onto DATEV also cited price, making it largely a cheaper-alternative problem rather than a preference for a rival ecosystem.
Where it was harder than planned. The Client Success lead did not accept the first version of the report. Their team had reviewed some of the same calls in its own conversation-intelligence tool, which had not marked them as support problems, and they challenged specific conversations: one customer had become insolvent, which is not a support matter at all. Two AI-assisted readings disagreeing settles nothing, so I went back through the disputed conversations by hand under a tighter rule (tag only on what the customer explicitly said, not on tone or inference) and removed six of the original 100 as non-customers, renewals, or unrelated to churn. The revised report states every methodology choice that could move a number, and names the single-reason customers so any of them can be opened and checked.
Time, depth, team
Six months of conversations, July to December 2025, analysed and reported in January 2026. 94 conversations with churned and at-risk customers, each tagged against seven themes on explicit customer statements, most against several. Two customers appear in more than one conversation; themes are tagged per conversation, not per customer. Mine end to end, working as an outside consultant: selecting the 100 candidate conversations, the theme scheme, tagging, analysis, report and the revision, using an internal conversation-analysis tool my business partner had built.
What the organisation did with it
- It went into the quarterly business review it was commissioned for, with all three leads in the room.
- Client Success worked the at-risk list, reviewing each of those accounts and closing the support issues still open on them.
- Client Success changed how it engages new accounts: earlier, and more regularly.
- Sales built a clearer value narrative against the cheaper incumbent, to justify the premium rather than discount against it.
What I'd do differently. Two things, though only the first was a mistake. I wrote the theme definitions myself and first showed them in a finished report to a Client Success lead who had their own tool and their own reading of the same conversations; agreeing them up front, and having the account owners check a sample while the analysis was still open, would have cost a day and saved the revision. The second is the order I put the themes in. Deciding what to act on first is what a consultant is for and I'd make that call again, but I judged how hard each fix would be without asking the people who would do the fixing, so when the report told Client Success to go first, my estimate of their work stood in for theirs. Next time I'd collect that before ranking, still make the call myself, and show the reasoning so it can be argued with rather than presenting an order as though it were a finding.
← All case studies Next: Sales coaching →